
"... and no one shall work for money, and no one shall work for fame; But each for the joy of the working, and each, in his separate star, shall draw the thing as he sees it, for the god of things as they are"
-Kipling
-Kipling
This page describes how to remotely debug C# executables running in Mono on the Beaglebone Black from a remote Linux PC using the MonoDevelop IDE. This page is part of a series of web pages which describe how to install C# and Mono on the Beaglebone Black and also how to configure a useful remote compilation and debugging toolchain for it.
The previous page in this series described the configuration of an NFS client-server relationship between the Beaglebone Black and a remote Ubuntu Linux 14.1.4 PC. This PC, known as the Development PC, runs the MonoDevelop IDE and is used to create C# projects and remotely compile them to executable form.
The MonoDevelop IDE contains a "soft debugger" which is designed to provide full debugging capabilities on remote .NET executables. MonoDevelop Soft Debugging is very capable (IMHO) and can do all the usual things one expects from a debugger - step through code, stop at breakpoints, observe the state of a variable and so on. It is pretty easy to set up, once you see how, and well worth doing. It is hard to emphasize how much more productive it is possible to be if one has the ability to step through ones remotely executing C# code.
In order to prove that remote debugging is working we will need something to debug. The examples below assume you have mapped the C# project output directory on the Development PC onto the Beaglebone Black as described in this web page.
Create a test project using the New Project Wizard in MonoDevelop called HelloWorldTest in the CSharpCode (or whatever you called it) subdirectory
which is mapped over to the Beaglebone Black and give it the following contents:
using System;

namespace HelloWorldTest
{
	class MainClass
	{
		public static void Main (string[] args)
		{
			Console.WriteLine ("Hello World 1");
			Console.WriteLine ("Hello World 2");
			Console.WriteLine ("Hello World 3");
		}
	}
}
We have three "Hello World" lines because eventually we are going to set a breakpoint on one and step through the remotely executing code. If you have used
the same directory structure as me, the executable for the HelloWorldTest project will be mapped into the
CSharpCode/HelloWorldTest/HelloWorldTest/bin/Debug/HelloWorldTest.exe
directory path and file. Before you continue, compile the project in the MonoDevelop IDE with a CTRL-F8 and then go over to a ssh window connected to the
Beaglebone Black and run the new executable with a commands like ...
cd ~/CSharpCode
mono ./CSharpCode/HelloWorldTest/HelloWorldTest/bin/Debug/HelloWorldTest.exe
...to ensure you can execute the project. Get this working before you continue.
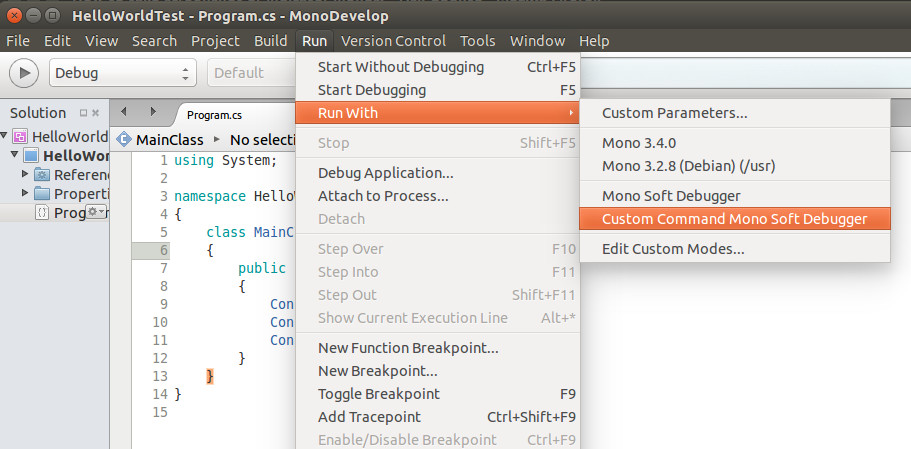
By default, MonoDevelop does not provide the menu items to invoke the Soft Debugger. You need to be able to access the
Custom Command Mono Soft Debugger menu item located under the Run-->RunWith menu option. To configure MonoDevelop to display this "hidden" menu
item you need to have a special MONODEVELOP_SDB_TEST environment variable present in the process when MonoDevelop is started. The easy
way to do this is edit your .profile file located in the home directory of the account with which you login to the
Development PC.
Edit the .profile file and add the following lines to the bottom of it.
# Set this to enable Remote Debugging In MonoDevelop
export MONODEVELOP_SDB_TEST=1
Once done, close MonoDevelop, log out, log back in and issue the command
echo $MONODEVELOP_SDB_TEST. You should see a value of 1
returned as a result. If that is not the case get this working before continuing.
Once the MONODEVELOP_SDB_TEST environment variable has been set, restart MonoDevelop. You should see that it now has a menu
Run-->RunWith-->Custom Command Mono Soft Debugger as shown in the image below.
As before, if you do not see the Custom Command Mono Soft Debugger menu item you will need to get that visible before proceed to the next step.
As mentioned previously, the code is normally executed with a statement like
mono ./CSharpCode/HelloWorldTest/HelloWorldTest/bin/Debug/HelloWorldTest.exe. In order to invoke the remote debugger you need
to run it on the Beaglebone Black with some additional parameters. The command below will do the job
mono --debug --debugger-agent=transport=dt_socket,address=0.0.0.0:12345,server=y /home/debian/CSharpCode/HelloWorldTest/HelloWorldTest/bin/Debug/HelloWorldTest.exe
Note the section 0.0.0.0:12345 in the command above is correct. You do not need to input the IP address of the Development PC in the command line. The
Soft Debugger is going to interpret the 0.0.0.0:12345 to mean "start and listen on port 12345 for something to connect and control
the debugging process".
When you run the above command, the process will look like it is hung - it is not! It is just waiting for MonoDevelop to contact it and how to do that is the topic of the next section. Leave it waiting and proceed to the next section.
Make sure the HelloWorldTest project is open in MonoDevelop and then place your cursor on the first line which says: Console.WriteLine ("Hello World 1");
Once you have done that, press the F9 key to set a breakpoint on that line. You will see the line change to a deep red background color.
Invoke the Custom Command Mono Soft Debugger using the menu combination Run-->RunWith-->Custom Command Mono Soft Debugger and you will find a form like the one illustrated below pops up.

Fill in the details as above. The IP address of the Beaglebone Black (in this example) is 192.168.1.102 and the the debugger on the Beaglebone Black
side is listening on port 12345. The fields that are blank in the above example can be left blank. It is not necessary to fill them in.
If, in the previous step, you left the executable running in debug mode over on the Beaglebone Black pressing the Connect button will contact that process and you will see the executable start and immediately stop when it hits the first breakpoint.
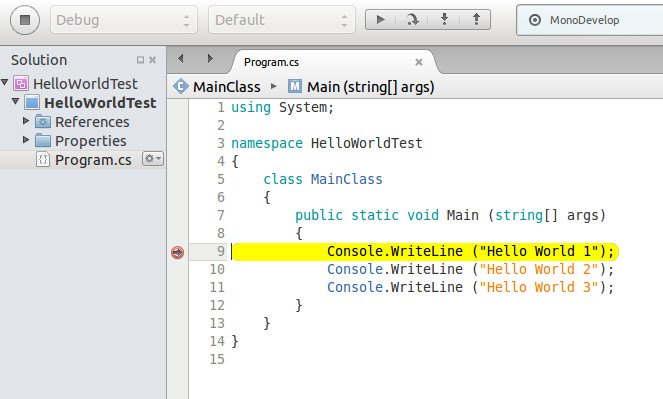
As can be seen in the above image, the thread of execution has stopped, the line at which the execution has stopped has changed to show a yellow background and MonoDevelop and is waiting for you to use the provided tools to step further through the code and/or inspect whatever variables you wish. In any event, you are now using the MonoDevelop IDE to debug a C# executable running remotely on a Beaglebone Black.
As mentioned in a previous page, rather than individually mapping each
output directory of a remote C# project over to the Beaglebone Black, an entire directory tree with
multiple projects was brought over. A shell script was created to run the executable and a similar script is especially useful in debug mode
because of all of the extra parameters. In order to facilitate a quick debug launch, I would create a file in the CSharpCode subdirectory named
debugHelloWorldTest which contains the following contents.
#! /bin/sh

mono --debug \
--debugger-agent=transport=dt_socket,address=0.0.0.0:12345,server=y \
/home/debian/CSharpCode/HelloWorldTest/HelloWorldTest/bin/Debug/HelloWorldTest.exe
This means that the executable can be placed in debug mode by running a simple command ./debugHelloWorldTest. I have created
a debug shell script for every project executable and I must say they are quite useful. I certainly do not want to be typing in all the command line options each time.
At this point you have now reached the final page in the series of web pages describing how to install Mono on the Beaglebone Black. Hopefully they have provided you with some useful advice and that you are now able to create a C# program on the Beaglebone Black and also remotely compile and debug C# executables on that platform using a nice tool chain. I wish you well - good luck.
The contents of this web page are provided "as is" without any warranty of any kind and without any claim to accuracy. Please be aware that the information provided may be out-of-date, incomplete, erroneous or simply unsuitable for your purposes. Any use you make of the information is entirely at your discretion and any consequences of that use are entirely your responsibility. All source code is provided under the terms of the MIT License.